

IELTS Cambridge Book 8 Test 1 AC – Task 1
Question –
WRITING TASK 1
You should spend 20 minutes on this task.
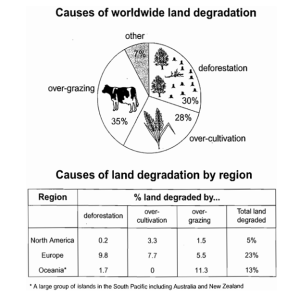
The pie chart below shows the main reasons why agricultural land becomes less productive. The table shows how these causes affected three regions of the world during the 1990s.
Summarise the information by selecting and reporting the main features, and make comparisons where relevant.
Write at least 150 words.
Answer –
The pie graph displays the primary causes of farmland degradation, while the table represents the impacts these factors had on three parts of the planet in the 1990s.
Overall, overgrazing is the most detrimental factor in decreasing farming land’s fertility. Moreover, the table shows that the proportion of unproductive land was far higher in Europe than in Oceania or North America.
Looking at the pie chart, repeated heavy grazing by farm animals accounts for the highest proportion of unproductive land, with just over a third of the total, followed by chopping down too many trees and forests, just below a third. While overproduction of crops constitutes the penultimate reason for lowering farmland yields, at approximately a quarter, ‘other’ unspecified reasons make up the remaining percentage.
Focusing on the table, 23% of European land was degraded in the 1990s, roughly double and five times that of Oceania and North America, respectively. Over-grazing constituted the prime factor for less yielding land in Oceania, with slightly more than a tenth, while in Europe, the principal cause was deforestation. Finally, in North America, over-cultivation was responsible for the highest proportion of less fertile land, at 3.3%.