Question –
WRITING TASK 1
You should spend 20 minutes on this task.
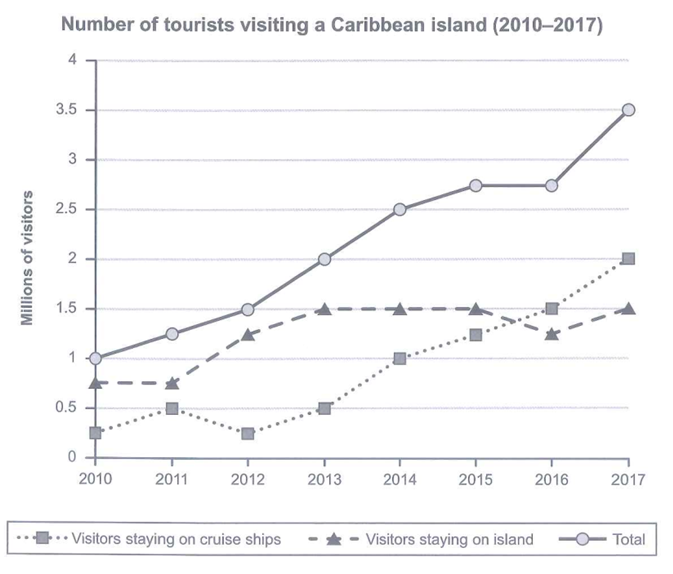
The graph below shows the number of tourists visiting a particular Caribbean island between 2010 and 2017.
Summarise the information by selecting and reporting the main features, and make comparisons where relevant.
You should write at least 150 words.

Answer –
The line chart displays how many tourists visited a specific Caribbean island from 2010 to 2017.
Overall, the total number of visitors to the Caribbean island rose significantly over the period in question. Another interesting feature is that more visitors stayed on cruise ships than on the island until 2016, but after that, the trend reversed.
Looking at the number of visitors staying on the island in 2010, a higher number of tourists preferred to spend their vacations on this island, with around 0.75 million, a figure which had not changed even after a year. From this, it went up to 1.5 million in 2013 and remained relatively stable until 2017, despite a dip of around 0.5 million in 2016.
The number of tourists that stayed on cruise ships was nowhere near that of the island’s value, with around 0.25 million at the start of the period, and it plateaued over the next two years before growing sharply to 2 million by the period’s end, becoming the more preferred mode of stay. The total number of visitors that vacationed on the island began the period given at one million, after which the value soared to 3.5 million by 2017, a rise of 2.5 million in a 7-year period.


