Question –
WRITING TASK 1
You should spend 20 minutes on this task.
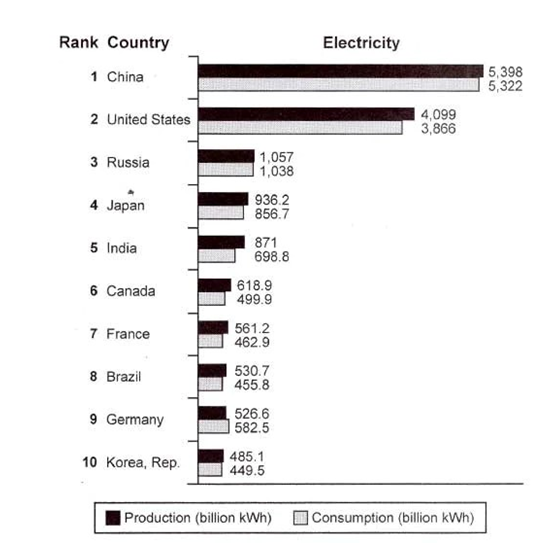
The bar chart below shows the top ten countries for the production and consumption of electricity in 2014.
Summarise the information by selecting and reporting the main features, and make comparisons where relevant.
Write at least 150 words.

Answer –
The bar chart displays how much electricity was generated and consumed in ten given nations in the year 2014.
Overall, what stands out is that the Chinese and Americans produced and utilised the highest amount of electric power by far, with the former topping the list. Moreover, all countries generated more electricity than they consumed, except for Germany, where the consumption was greater.
Regarding electricity production, China generated the highest quantity, at 5398 billion kWh, followed closely only by the US, with 4099 billion kWh. Russians, the Japanese, and Indians generated approximately a quarter of the USA’s value. The figures for Canada, France, Brazil and Germany ranged between 526.6 and 618.9 billion kWh, while the Republic of Korea ranked last, with 485.1 billion kWh of electricity generation.
Turning to consumption, Americans’, with 3866, and Indians’, with 698.8 billion kWh, figures were nowhere near the Chinese, in first place at 5322 billion kWh, but they were the countries with the biggest and second biggest surplus of electricity, with around 233 and 172 billion kWh, respectively. However, Germany was the only country with an energy deficit of around 56 billion kWh. In addition, Japan and Russia used about 950 billion kWh of electricity each, whereas the values for the remaining countries were slightly less than 500 billion kWh.


