Question –
WRITING TASK 1
You should spend 20 minutes on this task.
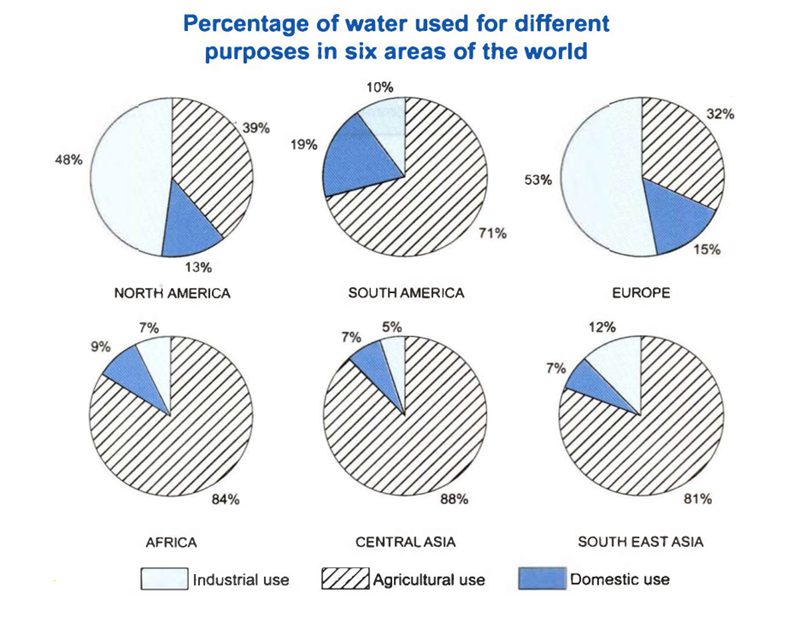
The charts below show the percentage of water used for different purposes in six areas of the world.
Summarize the information by selecting and reporting the main features and make comparisons where relevant.
Write at least 150 words.
Answer –
The pie charts illustrate how much water is used for industrial, agricultural, and domestic purposes in six regions of the Earth.
Overall, agriculture consumes the most water in all six areas, except for in North America and Europe, where the industry is responsible for the greatest consumption. Moreover, the highest share of domestic water is used in South America.
Looking at agricultural usage, the amount of water utilized for this purpose in Southeast Asia, Africa, and Central Asia lies between 81% and 88%. In South America, this figure accounts for nearly three-quarters of its total water use. Moreover, Europe’s consumption is just under a third, and just less than a tenth more of this figure is consumed in North America.
As for industrial use, Europeans top the list, with over half of the total water used by industries, followed by North Americans, at 48%. The value ranges from 5% to 12% in the remaining four areas. Regarding domestic use, South Americans consume at nearly a fifth of their total water for household purposes, approximately double the figures for Africans, Central and South East Asians. Europe, at 15%, uses 2% more water to complete domestic chores than North America.