

IELTS Cambridge Book 7 Test 4 AC – Task 1
Question –
WRITING TASK 1
You should spend 20 minutes on this task.
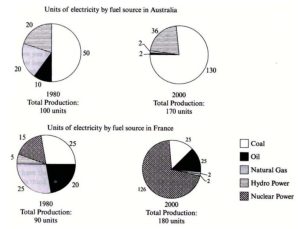
The pie charts below show units of electricity production by fuel source in Australia and France in 1980 and 2000.
Summarize the information by selecting and reporting the main features and make comparisons where relevant.
Write at least 150 words.
Answer –
The pie graphs display how much power was generated from coal, oil, natural gas, hydropower and nuclear power stations in Australia and France in 1980 and 2000.
Overall, total power production experienced a significant increase in both countries over the recorded period. The number of units of electricity produced by burning coal was the highest in Australia in both years, whereas the primary fuel sources in France were natural gas and coal in 1980 but only nuclear power in 2000.
According to the charts for Australia, the highest amount of electricity produced from coal was 50 units in 1980, and it increased approximately threefold to 130 units in 2000. Hydropower stations accounted for a fifth of total electricity produced, and then this figure showed a slight increase to 36 units. Natural gas and oil started the period at 20 and 10 units, respectively, and each of them decreased considerably to 2 units in the final year.
In France, 15 units of electrical power were produced by nuclear power stations at the start of the period, and it then rose dramatically to 126 units in 2000. Similarly, oil was initially used to produce 20 units of electricity, and this figure experienced a slight growth to 25 units. The energy produced from hydropower and natural gas started at 15 and 5 units, respectively, but this number dropped substantially to 2 units each. However, unlike Australia, coal power plants produced the same amount of power in France, at 25 units, in both years.