Question –
WRITING TASK 1
You should spend 20 minutes on this task.
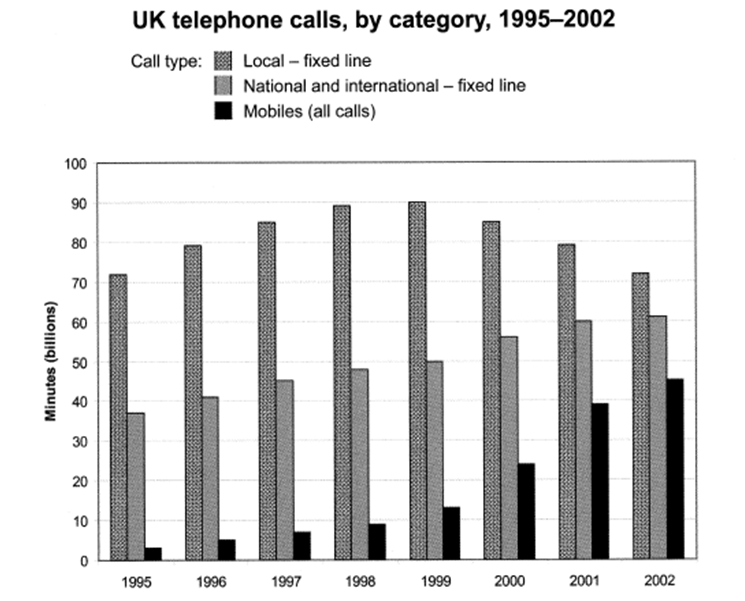
The chart below shows the total number of minutes (in billions) of telephone calls in the UK, divided into three categories, from 1994 to 2001.
Summarise the information by selecting and reporting the main features, and make comparisons where relevant.
Write at least 150 words.

Answer –
The bar graph illustrates how many minutes were spent on three types of telephone calls made in the United Kingdom between 1995 and 2002
Overall, the recorded period saw a relatively stable amount of time spent on local fixed-line phone calls despite a peak in 1999. In contrast, time expended on national and international fixed-line and mobile calls increased, with the figure for mobile calls displaying a more significant increase over the 8-year period. Also, the gap between the three categories shrank considerably over the second half of the period.
Minutes spent on local calls started the period with just over 70 billion in 1995, and after that, this figure rose and peaked at 90 billion minutes in 1999 before decreasing steadily. By the period’s end, it had slipped back to the same figure as in 1995.
National and international calls increased steadily year on year, from just under 40 billion minutes in 1995 to just over 60 billion in 2002. Having experienced a gradual growth over the 4-year period, from around 3 billion minutes initially to around 12 billion in 1999, mobile call minutes then rocketed to finish the period in question at around 45 billion.
