

IELTS Cambridge Book 7 Test 3 AC – Task 1
Question –
WRITING TASK 1
You should spend 20 minutes on this task.
The chart below shows information about changes in average house prices in five different cities between 1990 and 2002 compared with the average house prices in 1989.
Summarise the information by selecting and reporting the main features, and make comparisons where relevant.
You should write at least 150 words.
Answer –
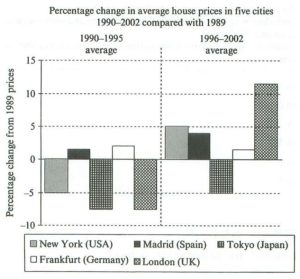
The bar graph compares the average house prices in five cities from 1990 to 2002 with the average real estate prices in 1989.
Overall, what stands out from the graph is that prices of houses generally decreased between 1990 and 1995, while they mostly increased from 1996 to 2002, when compared to the base year. However, the most significant changes were observed in London’s house prices.
The average prices of houses in Tokyo and London experienced the sharpest decrease of approximately 7% in the period of 1990-1995 compared to their average prices in 1989, and similarly, the house prices in New York dipped by 5%. In contrast, Spanish and German homebuyers in Madrid and Frankfurt paid more in the same period, by roughly 2% and 3%, respectively.
Looking at the period from 1996 to 2002, with a price hike of nearly 12% compared to 1989 and roughly 20% compared to 1990-1995, London topped the list as the city with the highest increase in house pricing, and in Frankfurt, Madrid, and New York, these prices grew by between around 1% and 5% with regard to the base year. However, only Tokyo’s house prices went down by 5% over the same period.