Question –
WRITING TASK 1
You should spend 20 minutes on this task.
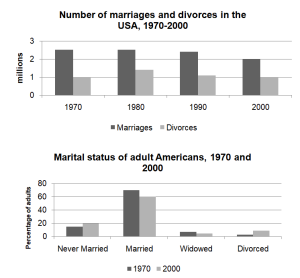
The charts below give information about USA marriage and divorce rates between 1970 and 2000, and the marital status of adult Americans in two of the years.
Summarise the information by selecting and reporting the main features, and make comparisons where relevant.
Write at least 150 words.

Answer –
The bar graphs illustrate the number of marriages and divorces in the United States between 1970 and 2000 and the marital status of adult people in the US during those two years.
Overall, the number of marriages in the US decreased over the period, and the divorce rate remained relatively stable despite peaking in 1980. The percentages for people who were married and widowed witnessed downward trends, while the shares for people who were never married and divorced went up.
The number of married adults in the United States began the period in question at 2.5 million, and the figure remained the same even after a decade before decreasing continuously and reaching its lowest figure of 2 million in 2000. On the other hand, 1 million marriages in America ended with a divorce at the beginning of the given period, and the figure peaked at just below 1.5 million in 1980, but it slipped back to its initial value by 2000.
Regarding marital status, most adult Americans were married in 1970, with roughly three quarters. In contrast, those who did not marry even once accounted for roughly a fifth of that value, and as for widowed and divorce figures, they were around 7% and about 2%, respectively. However, after 3 decades, the figures for married couples and those who lost their spouse fell to 60% and about 5%, whereas the proportions of those who never married and were divorced went up to 20% and approximately a tenth, respectively.
