

IELTS Cambridge Book 4 Test 3 AC – Task 1
Question –
WRITING TASK 1
You should spend 20 minutes on this task.
The chart below shows the different levels of post-school qualifications in Australia and the proportion of men and women who held them in 1999.
Write a report for a university lecturer describing the information shown below.
You should write at least 150 words.
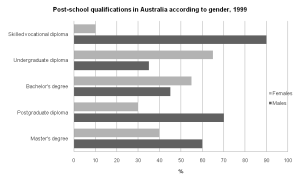
The bar graph depicts the percentage of Australian men and women with various tiers of diplomas and degrees in the year 1999.
Overall, it can be seen that, proportionally, males dominated all levels of post-school qualification, except for the categories of undergraduate diploma and bachelor’s degree, where females were more than men. The highest share of males earned a skilled vocational diploma, while the greatest percentage of women studied for an undergraduate diploma.
Looking at men-dominated fields, an overwhelming percentage of men preferred skilled vocational diploma courses, with 90%, and women’s value was just 10%. Moreover, 70% of men chose a postgraduate diploma, whereas females who opted for this stream were roughly half of that. The share of men who pursued a master’s degree was greater than women’s, with 60% and 40%, respectively.
As for the subjects with higher women participation, the undergraduate diploma was nowhere near as popular in men as in women in Australia, as the former’s value was about a third, while the latter’s figure made up two-thirds of the total students. In addition, the percentage of women who chose a bachelor’s degree, at roughly 55%, was around a tenth more than the figure for men.