

IELTS Cambridge Book 4 Test 2 AC – Task 1
Question –
WRITING TASK 1
You should spend 20 minutes on this task.
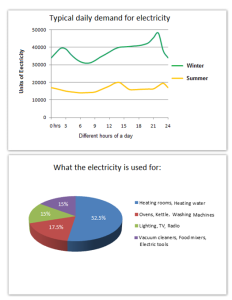
The graph below shows the demand for electricity in England during typical days in winter and summer. The pie chart shows how electricity is used in an average English home.
Summarise the information by selecting and reporting the main features and make comparisons where relevant.
You should write at least 150 words.
Answer –
The line graph depicts how much electricity is typically consumed in England in summers and winters, while the pie chart displays four ways electricity is utilised in average English households.
Overall, the electricity demand is not only higher in winter than in summer throughout the day but also varies more widely during wintry nights.
Looking at the line graph, around 35,000 units of electricity are consumed in England during a typical day in winter, and this demand remains between 30,000 and 40,000 units until around 6 o’clock in the evening. Thereafter, it rises to slightly less than 50,000 at around 9:00 pm, and then, the value dips to around 35,000 close to midnight. However, during the summer season, the figure remains between around 15,000 and 20,000 units throughout the day, with value peaking at around 1:00 pm and 11:00 pm.
Focusing on the pie chart, heating rooms and water take up the majority of electricity, at 52.5%, while electricity used to operate ovens, kettles, and washing machines is roughly a third of that figure. Moreover, the electricity consumption for lighting, TV, and radio is precisely as much as for operating vacuum cleaners, food mixers, and electrical tools, at 15% each.