WRITING TASK 1
You should spend 20 minutes on this task.
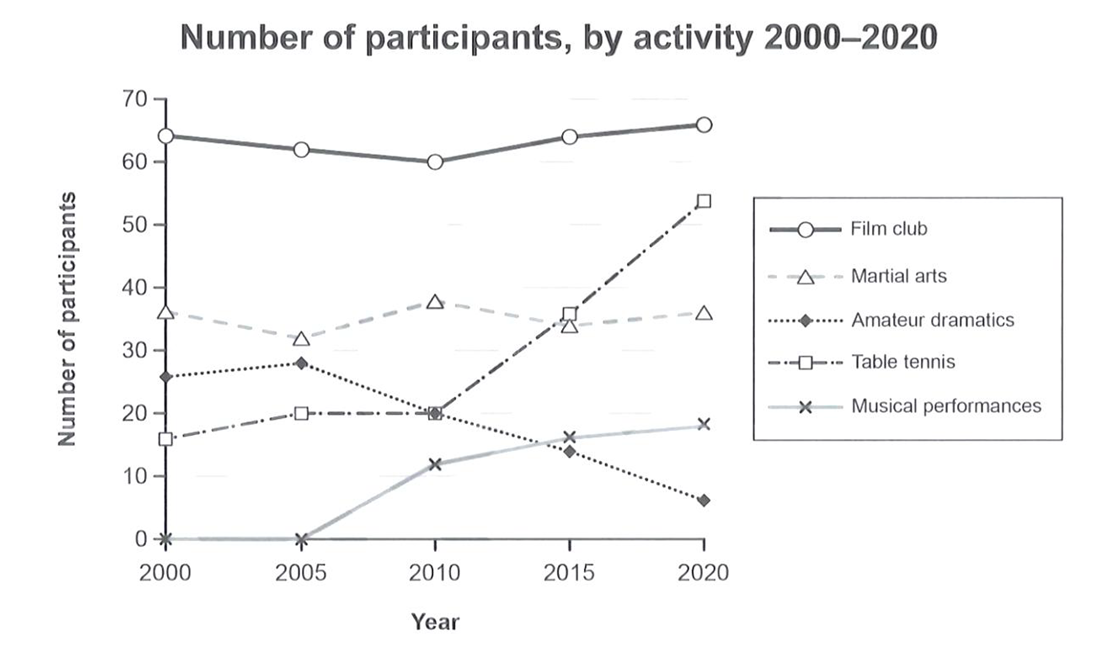
The graph below gives information on the numbers of participants for different activities at one social centre in Melbourne, Australia for the period 2000 to 2020.
Summarize the information by selecting and reporting the main features and make comparisons where relevant.
Write at least 150 words.

The line graph displays how many people took part in five activities at a social centre in Melbourne, a city in Australia, between 2000 and 2009.
Overall, the number of people participating in musical performances and table tennis rose sharply, while the figure for amateur dramatics fell drastically over the period in question. Moreover, joining the film club remained the most popular activity throughout the recorded period.
In 2000, around 65 people preferred to associate with a movie club, and despite a minor dip in 2010 to around 60, it rose marginally and reached about 68 by 2020. The figure for those opting for martial arts fluctuated between around 30 and 40 over the 20 years. However, only amateur dramatics’ popularity declined from approximately 28 people choosing it in the first year to around a quarter of that after 20 years, making it the least famous activity.
Around 18 people chose to play table tennis at the start of the period, and this figure grew slightly to around 20 before skyrocketing to about 55 people by the period’s end. Moreover, until 2005, no one took any interest in music, but after that, the number of people participating in it went up consistently year after year, and by 2020, around 20 people gave such performances.
