Question –
WRITING TASK 1
You should spend 20 minutes on this task.
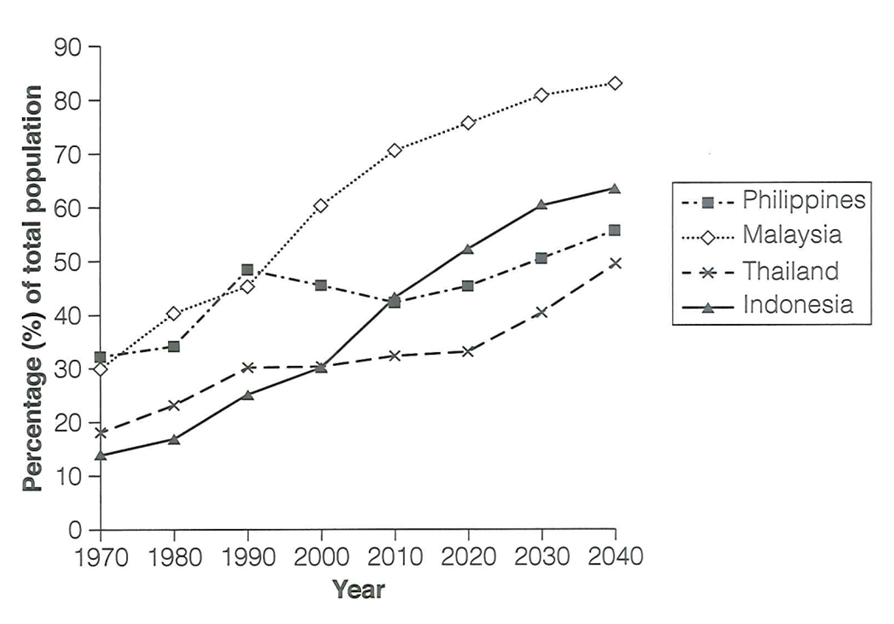
The graph below gives information about the percentage of the population in four Asian countries living in cities from 1970 to 2020, with predictions for 2030 and 2040.
Summarize the information by selecting and reporting the main features and make comparisons where relevant.
Write at least 150 words.

Answer –
The line chart depicts the proportions of people who lived in cities in the Philippines, Malaysia, Thailand, and Indonesia between 1970 and 2020, along with projections for 2030 and 2040.
Overall, the percentages of city residents in all four Asian nations increased in 2020, and similar upward trends are predicted until 2040. Malaysia had and is expected to have the highest percentage of people residing in cities in all the given years, except for 1970 and 1990, when the Philippines’ figure was higher than that of any other nation.
At the start of the period, the proportion of Filipinos living in cities was the highest, at around a third, and their numbers then grew to around a half of the total population in 1990, but after that, the trend reversed, and the value fell to around 40% after 20 years. While the proportion is projected to increase and reach about 55% by 2040, it will fall to third place. Moreover, the percentage of the population that lived in Malaysian cities rose significantly from 30% in 1970 to around three quarters by 2020, and after that, this figure is expected to grow even further by roughly 5% by the end of the given period, making it the highest value on the graph.
At the beginning of the period, around a fifth of Thai people lived in urban areas, after which it grew marginally by around 10% over half a decade, and thereafter, it will go up to around 50% by the period’s end. In 1970, the share of individuals living in Indonesia’s urban areas was the lowest, at around 15%, before increasing rapidly to about 55% by 2020. This figure may reach around 65% in 2040, becoming the second-highest value.
