Question –
WRITING TASK 1
You should spend 20 minutes on this task.
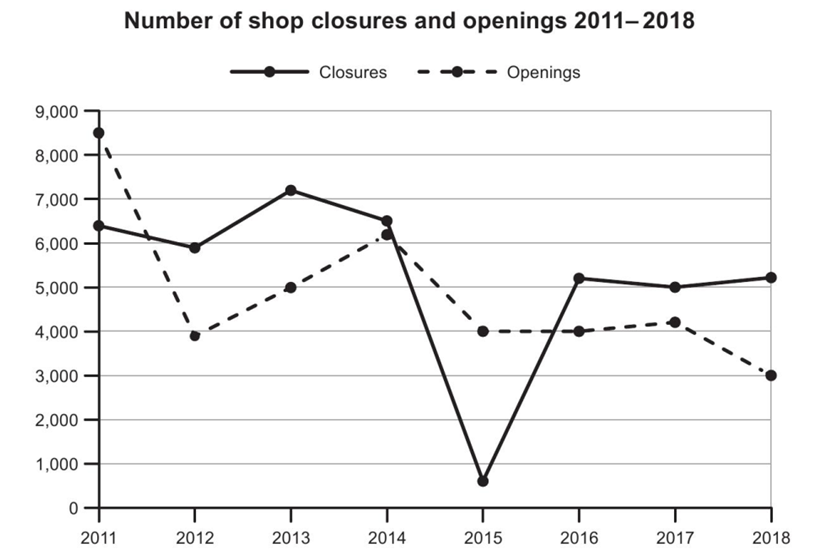
The graph below shows the number of shops that closed and the number of new shops that opened in one country between 2011 and 2018.
Summarise the information by selecting and reporting the main features, and make comparisons where relevant.
You should write at least 150 words.

Answer –
The line chart displays how many stores were newly opened and closed in a particular nation from 2011 to 2018.
Overall, it can be seen that both the number of new store openings and closures experienced a fall over the recorded period, with shop openings displaying the most dramatic decline. Another significant feature is that more shops were closed than opened throughout the period, except for 2011 and 2015.
The number of shops opened at the start of the period was the highest, with roughly 8500, and the figure plummeted to about 4000 after only one year. Despite a minor rise of around 2000 in 2014, this number stayed relatively constant at around 4000 until 2017 before decreasing gradually to its low of 3000 by the period’s end.
The number of shop closures remained almost the same at about 6100 for the first two years, after which it grew to around 7100 by 2013. However, it dipped continuously over the next two years, reaching roughly 500, the lowest value on the graph, before rising and remaining relatively stable at approximately 6100 from 2016 to 2018.
