Question –
WRITING TASK 1
You should spend 20 minutes on this task.
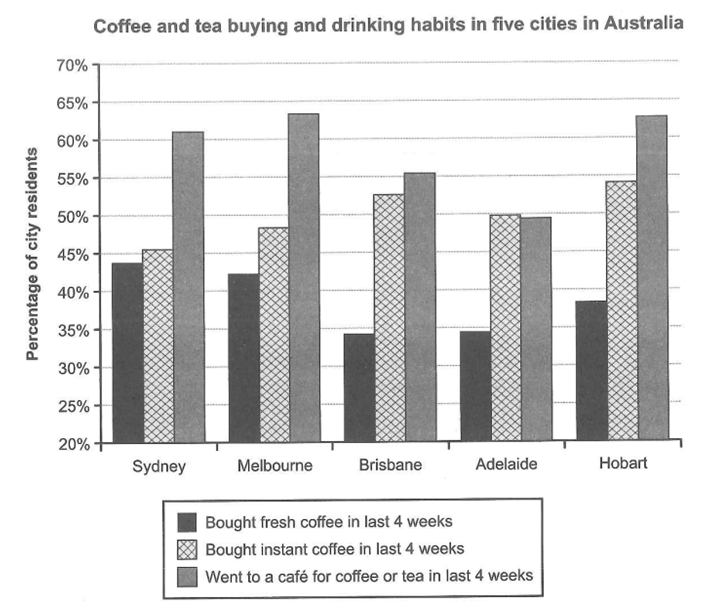
The chart below shows the results of a survey about people’s coffee and tea buying and drinking habits in five Australian cities.
Summarise the information by selecting and reporting the main features, and make comparisons where relevant.
Write at least 150 words.

Answer –
The bar graph illustrates the outcome of a survey regarding individuals’ habits of purchasing fresh or instant coffee and going to a café to consume tea or coffee in five cities in Australia.
Overall, it can be seen that the percentage of those who went to a café in the last four weeks was the highest in all locations, except for Adelaide, where the figure for instant coffee was the greatest. By contrast, buying fresh coffee accounted for the lowest figures everywhere on the graph.
The proportions of those visiting cafes for drinking coffee or tea in Sydney, Melbourne and Hobart ranged between around 61% and about 64%. Moreover, in Brisbane, the figure was slightly more than 55%, about 6% greater than the figure for Adelaide.
As for buying coffee, Hobart topped the list, with nearly 55% of its residents having purchased instant coffee in the last four weeks, but in Adelaide, the highest number of individuals residing there bought it, at precisely half of the total. This figure for Brisbane comprised roughly 53%, approximately 10% more than Melbourne’s and Sydney’s figures. Looking at fresh coffee, the percentages of those surveyed who bought fresh coffee were around 43% in Sydney and Melbourne and about a third in Brisbane and Adelaide. At last, roughly 37% of Hobart’s residents purchased freshly ground coffee.
