

IELTS Cambridge Book 11 Test 4 AC – Task 1
Question –
WRITING TASK 1
You should spend 20 minutes on this task.
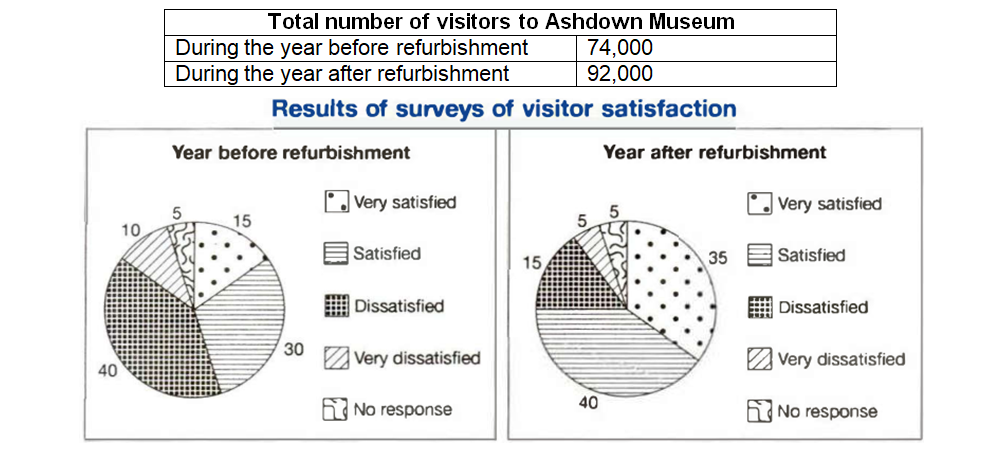
The table below shows the numbers of visitors to Ashdown Museum during the year before and the year after it was refurbished. The charts show the result of surveys asking visitors how satisfied they were with their visit, during the same two periods.
Summarise the information by selecting and reporting the main features, and make comparisons where relevant.
You should write at least 150 words.
Answer –
The table illustrates how many tourists went to Ashdown Museum the year prior to and following its renovation. At the same time, the pie charts depict the satisfaction levels of visitors who visited the museum in the same two years.
Overall, visitor numbers went up significantly following the planned renovation. Moreover, patrons’ satisfaction levels saw a considerable increase, with those saying they were quite satisfied displaying the most noticeable rise over the period in question.
A total of 74,000 people visited the Ashdown Museum before it underwent refurbishment. Of these people, 30% said they were satisfied, and precisely half of that figure reported being extremely content with their visit. However, the percentage of tourists who were unhappy was the highest, at 40%, and a quarter of this value was highly disappointed, while 5% chose not to respond.
In the latter period, the number of visitors to this museum rose to 92,000 after renovating it. Survey results show that the proportion of people who were very satisfied and satisfied slightly more than doubled and rose by 10%, respectively. On the other hand, the figures for very dissatisfied and dissatisfied visitors halved and roughly halved in the respective order. Nonetheless, the value for those without response did not change over the recorded period.