

IELTS Cambridge Book 11 Test 2 AC – Task 1
Question –
WRITING TASK 1
You should spend 20 minutes on this task.
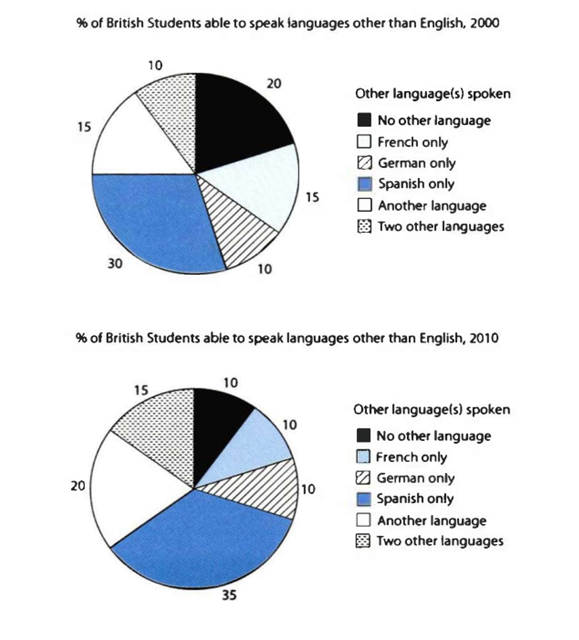
The charts below show the proportions of British students at one university in England who were able to speak other languages in addition to English, in 2000 and 2010.
Summarise the information by selecting and reporting the main features and making comparisons where relevant.
Write at least 150 words.
Answer –
The pie charts depict the proportion of British pupils studying at a university in England who spoke an additional language alongside English in 2000 and 2010.
Overall, the percentage of monolingual students decreased, while the figure for multilingual increased over the period in question. Moreover, the popularity of only the French language fell, whereas Germany’s remained the same.
In 2000, the share of British pupils who also spoke Spanish was the highest, at 30%, and precisely half of this number spoke either French or another unidentified language. 20% of these university students could speak only English, while half of that number spoke German or two other languages besides English.
Focusing on 2010, Spanish remained the most popular language for Britishers, and its value rose even further to slightly over a third, while an unspecified language was the second favourite, with a fifth of total students speaking it. Similarly, the figure for those who could speak two or more additional languages rose by 5%. However, the shares of monolinguals and those speaking French dropped by half and 5% to a tenth each, but the value of German speakers did not change over the recorded period.