Question –
WRITING TASK 1
You should spend 20 minutes on this task.
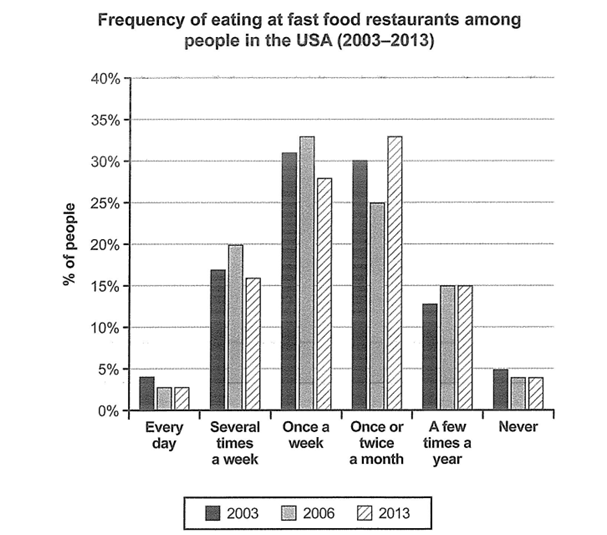
The chart below shows how frequently people in the USA ate in fast food restaurants between 2003 and 2013.
Summarise the information by selecting and reporting the main features, and make comparisons where relevant.
Write at least 150 words.
Answer –
The bar chart displays how often individuals in America dined at fast food outlets from 2003 to 2013.
Overall, the percentage of people who ate once a week in restaurants that sold fast food was the highest in 2003 and 2006, but not in 2013, when the figure for once or twice a month was the greatest. In comparison, the figure for every day was the lowest over the period in question.
Looking at 2003, the proportion of people visiting fast food restaurants once a week to dine in was the greatest, at around 31%, and it was roughly 1% more than the value of once or twice a month. In comparison, the shares of several times a week and a few times a year were around 18% and approximately 14%, respectively. Finally, the figures for those going to a fast food place every day and never going to a fast food restaurant were slightly under 5%.
Concerning 2006 and 2013, the percentages of those dining in fast food outlets once a week and several times a week increased to a third and a fifth, respectively, before decreasing by roughly 4% each. However, once or twice a month experienced the opposite trend, where the values were a quarter and around a third in respective years. The shares of every day and never categories dipped by around 1% in 2006 and remained the same in 2013, but a few times a year’s data rose by 1% before levelling off.