

IELTS Cambridge Book 11 Test 3 AC – Task 1
Question –
WRITING TASK 1
You should spend 20 minutes on this task.
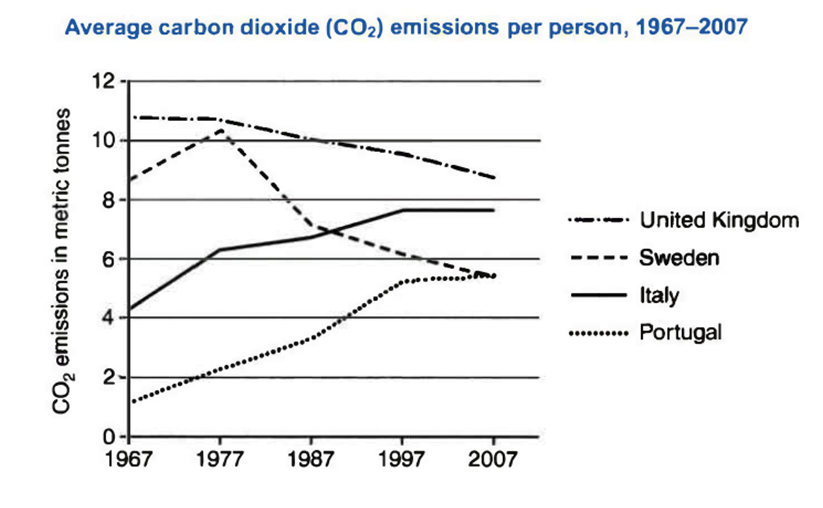
The graph below shows average carbon dioxide (CO2) emissions per person in the United Kingdom, Sweden, Italy and Portugal between 1967 and 2007.
Summarise the information by selecting and reporting the main features, and making comparisons where relevant.
Write at least 150 words.
Answer –
The line chart displays how much carbon dioxide, on average, was emitted per capita in four European countries, the UK, Sweden, Italy, and Portugal, from 1967 to 2007.
Overall, the average amount of CO2 produced by each person rose in Portugal and Italy, whereas this figure witnessed a downfall in the UK and Sweden over the recorded period. Moreover, Britishers produced the highest amount of this gas throughout the period.
Looking at the UK and Sweden, the former’s value started the period at the top with around 11 metric tonnes, and after that, this amount dipped slightly to around 9 metric tonnes by 2007. In addition, at the beginning of the period, Swedes expelled around 9 metric tonnes of CO2. It then increased marginally to just more than 10 metric tonnes over the next 20 years before plummeting by roughly half that by the period’s end.
As for the remaining categories, Italians emitted around 4 metric tonnes of carbon dioxide gas in 1967, and from this, the amount kept on increasing consistently year-on-year to reach just less than 8 metric tonnes in 1997, and it then levelled off until 2007. Initially, the Portuguese produced the least amount of CO2 at about 1.5 metric tonnes, and then, there was a significant incline in this value to around 5.5 metric tonnes, and it finished the period as the joint least producers with Sweden.