

IELTS Cambridge Book 8 Test 4 AC – Task 1
Question –
WRITING TASK 1
You should spend 20 minutes on this task.
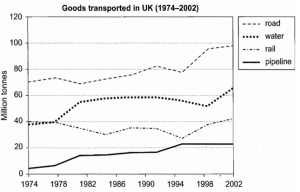
The graph below shows the quantities of goods transported in the UK between 1974 and 2002 by four different modes of transport.
Summarise the information by selecting and reporting the main features, and make comparisons where relevant.
You should write at least 150 words.
Answer –
The line chart displays how many tonnes of goods were transported in the UK by rail, road, water, and pipeline from 1974 to 2002.
Overall, the figure for goods transported by all four categories showed a steady increase, apart from rail, which remained relatively stable over the period. Furthermore, the highest tonnage of goods was distributed by road, while the pipeline carried the lowest weight throughout the recorded period.
Focusing on water and rail as means of transport, the number of tonnes of goods transported by water started at just under 40 million, and this rose by nearly 50% in 1982 and remained relatively constant until 1994. In the final year, it jumped again to just over 60 million tonnes, following a brief decline in 1998 to around 50 million. However, the rail transport figure fell from 40 million tonnes in 1974 to about 30 million in 1994, with mild fluctuations, before eventually recovering to its original number by 2002.
As for haulage via road and pipeline, the figure for hauling goods by road was the highest in 1974, with approximately 70 million tonnes. Despite a slight dip in 1982 and 1994, this value increased steadily to roughly 100 million tonnes by 2002. The pipeline system was used to ship the lowest amount of merchandise in 1974 at about 4 million tonnes, but this figure had risen to just over 20 million tonnes by 1994 before reaching a plateau until the period’s end.