Question –
WRITING TASK 1
You should spend 20 minutes on this task.
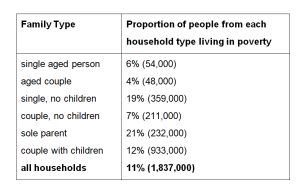
The table below shows the proportion of different categories of families living in poverty in Australia in 1999.
Summarise the information by selecting and reporting the main features, and make comparisons where relevant.
You should write at least 150 words.

Answer –
The table displays the percentage of different types of Australian families living in poverty in the year 1999.
Overall, elderly people, whether single or married, were least affected by the financial crisis, while people raising their offspring alone suffered the most.
In Australia, slightly less than 2 million households lived below the poverty line, which made up 11% of total families. The percentage of aged couples suffering from scarcity of money was the lowest, at 4%, and this figure for older people who were single stood at 6%.
Just above a fifth of families faced financial trouble where individuals reared their children without any spouse, and singles without any children were only slightly better off than them, at 19%. However, their numbers were much higher at 359,000. 933,000 Australian couples who fostered children lived in poverty, but the figure for couples who did not have any offspring was roughly a quarter of that value.
