Question –
WRITING TASK 1
You should spend 20 minutes on this task.
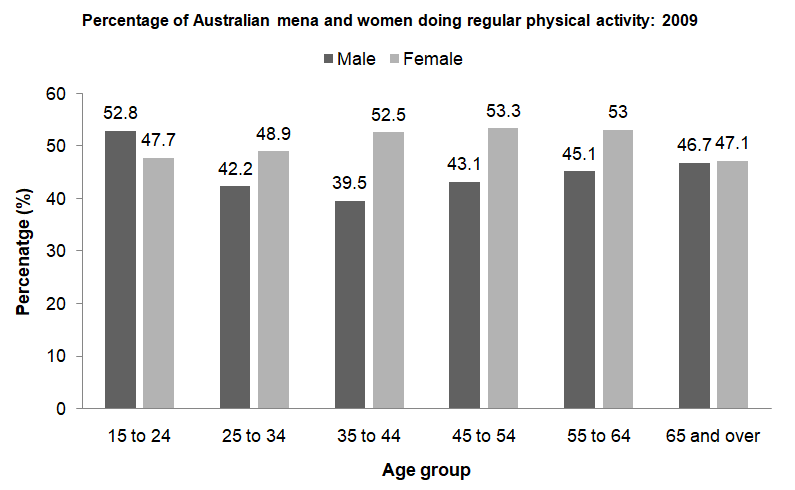
The bar chart below shows the percentage of Australian men and women in different age groups who did regular physical activity in 2009.
Summarise the information by selecting and reporting the main features, and make comparisons where relevant.
Write at least 150 words.

Answer –
The bar chart displays the share of Australian males and females, according to six age categories, who regularly engaged in some physical activities in 2009.
Overall, what stands out is that the percentage of females who did physical activity regularly was the highest for 45-to- 54-year-olds, while this figure was the greatest for males in the 15 to 24 age bracket. Moreover, proportionally, more women did frequent physical activity than men in all age groups, apart from the youngest.
Looking at Australian men, the share of males in Australia who were physically active was the highest for those belonging to the 15 and 24 age bracket, at 52.8%, after which the figure fell continuously for the following two age bands, reaching its lowest value of 39.5% for 35-to-44-year-olds. After that, men again started to become physically active, and the share kept on increasing to 46.7% for those at least 65 years old.
As for Australian females, 47.7% of 15-to-24-year-olds were engaged in regular physical activity, and with age, the share of physically active females went up to a chart high of 53.3% for the age group 45 to 54. However, this figure started to fall for the next two age bands, and the figure recorded for females who were 65 and over was 47.1%, meaning they were the least physically active female group.


