

IELTS Cambridge Book 6 Test 2 AC – Task 1
Question –
WRITING TASK 1
You should spend 20 minutes on this task.
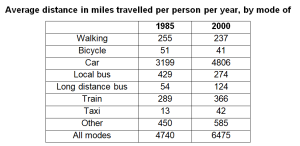
The table below gives information about changes in modes of travel in England between 1985 and 2000.
Summarise the information by selecting and reporting the main features, and make comparisons where relevant.
Write at least 150 words.
Answer –
The table displays, on average, how much distance was travelled per capita in a year by an Englishman using different means of transportation in two years, 1985 and 2000.
Overall, the average distance covered by each person in England using all types of transport increased, except for walking, cycling, and travelling by local bus, which saw a drop. Moreover, the car was by far the most favoured transport mode in both years.
In 1985, on average, the longest distance per person was covered by car at nearly 3200 miles, followed by local bus’ value at 429. The average distances covered by train and walking made up around 270 miles, while the figures for long-distance buses and taxis accounted for roughly 52 miles, triple that of taxis. By ‘other’ unspecified modes, each individual’s average came out to be 450 miles, and the combined total was 4740 miles.
Focusing on 2000, after 15 years, the car’s popularity grew even further by around 50%. Similarly, the figures for average per capita distance travelled by long-distance bus and taxi were slightly more than doubled and roughly tripled, respectively, and the values for the train and ‘other modes’ rose to 366 and 585 miles in the respective order. However, the average distance each person travelled on foot and a bike went down by roughly 12 miles each, and likewise, journeys made by local buses decreased to 274 miles, while the total rose to 6475 miles.