

IELTS Cambridge Book 6 Test 1 AC – Task 1
Question –
WRITING TASK 1
You should spend 20 minutes on this task.
The graph and table below give information about water use worldwide and water consumption in two different countries.
Summarise the information by selecting and reporting the main features, and make comparisons where relevant.
Write at least 150 words.
Answer –
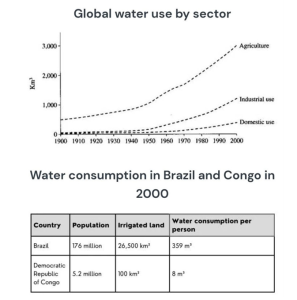
The line chart illustrates the global water consumption by sector between 1900 and 2000, whereas the table displays reasons for the amount of water consumed in Brazil and Congo in 2000.
Overall, the water consumption of the three given sectors experienced an upward trend, and agriculture consumed the highest amount of water throughout the recorded period. In 2000, the irrigated land and water usage per capita were significantly greater in Brazil than in Congo.
In 1900, agriculture used around 500 km3 of water, after which this figure increased substantially to approximately 3,000 by the end of the period. Water consumption by industry started at around 50 km3, and then it experienced the most significant increase to roughly 1,200 km3 after a century. The domestic sector used a negligible amount of water in 1900, and then this figure rose to approximately 400 km3 in 2000, and people consumed the least quantity of water for this purpose.
In 2000, Brazil’s population was 176 million, far greater than the 5.2 million in Congo. Water consumption per capita in Brazil was 359 m3, while this figure in Congo was only 8 m3, which could be because Brazil had 26,500 km2 of irrigated land, whereas Congo had only 100 km2.