

IELTS Cambridge Book 3 Test 4 AC – Task 1
WRITING TASK 1
You should spend 20 minutes on this task.
The graph below shows the unemployment rates in the US and Japan between March 1993 and March 1999.
Write a report for a university lecturer describing the information shown below.
You should write at least 150 words.
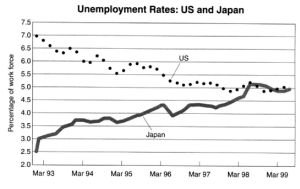
The line graph displays the percentage of unemployed people in America and Japan from March 1993 to March 1999.
Overall, it can be seen that the rate of unemployment in Japan increased, while it decreased in the US over the period in question. Moreover, the proportion of people without work was initially higher in the US than in Japan, but the figures were similar by the period’s end.
In the US, at the beginning of the period, 7% of the American workforce did not have any work. After that, this figure kept falling despite minor fluctuations; by March 1998, around 5% of people eligible for work were unemployed. From this, the value remained relatively the same until the end of the period given.
Focusing on Japan, the share of eligible Japanese workers without work started the period at 2.5%, and in spite of mild variations, this value grew significantly, and after half a decade, it doubled to 5%. Thereafter, the share of the workforce facing unemployment levelled off until the following year, when the value was comparable to the USA.