Question –
WRITING TASK 1
You should spend 20 minutes on this task.
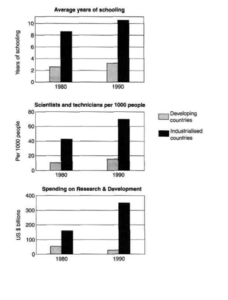
The charts below show the levels of participation in education and science in developing and industrialised countries in 1980 and 1990.
Write a report for a university lecturer describing the information shown below.
You should write at least 150 words.

Answer –
The bar charts display the average years spent in schools, the number of scientists and technicians produced and money spent on research and development in developing and industrialized nations in 1980 and 1990.
Overall, the figures for the years, on average, spent in school and the number of scientists and technicians per thousand people rose in both developing and industrial nations. Moreover, the amount of money invested in research and development increased in developed economies, but this amount decreased for the other category.
In 1980, the average time spent on schooling was around 2.5 years, and it grew to 3.5 years after a decade in developing economies, and due to this, the number of scientists and technical workers roughly doubled from around 10 to around 20 per 1000 people. Similarly, in advanced countries, the figure for schooling climbed from about 8.5 years to 10.5 years over ten years, and the number of people working in science and technical fields went up from around 41 to about 70.
As for spending on research and development, although the number of technicians and scientists grew in countries with developing economies, the money they spent roughly halved in 1990 from around $50 billion in the initial year. However, the reverse was true for industrial countries, where this amount slightly more than doubled from roughly 150 billion dollars to approximately $350 billion over a 10-year period.


